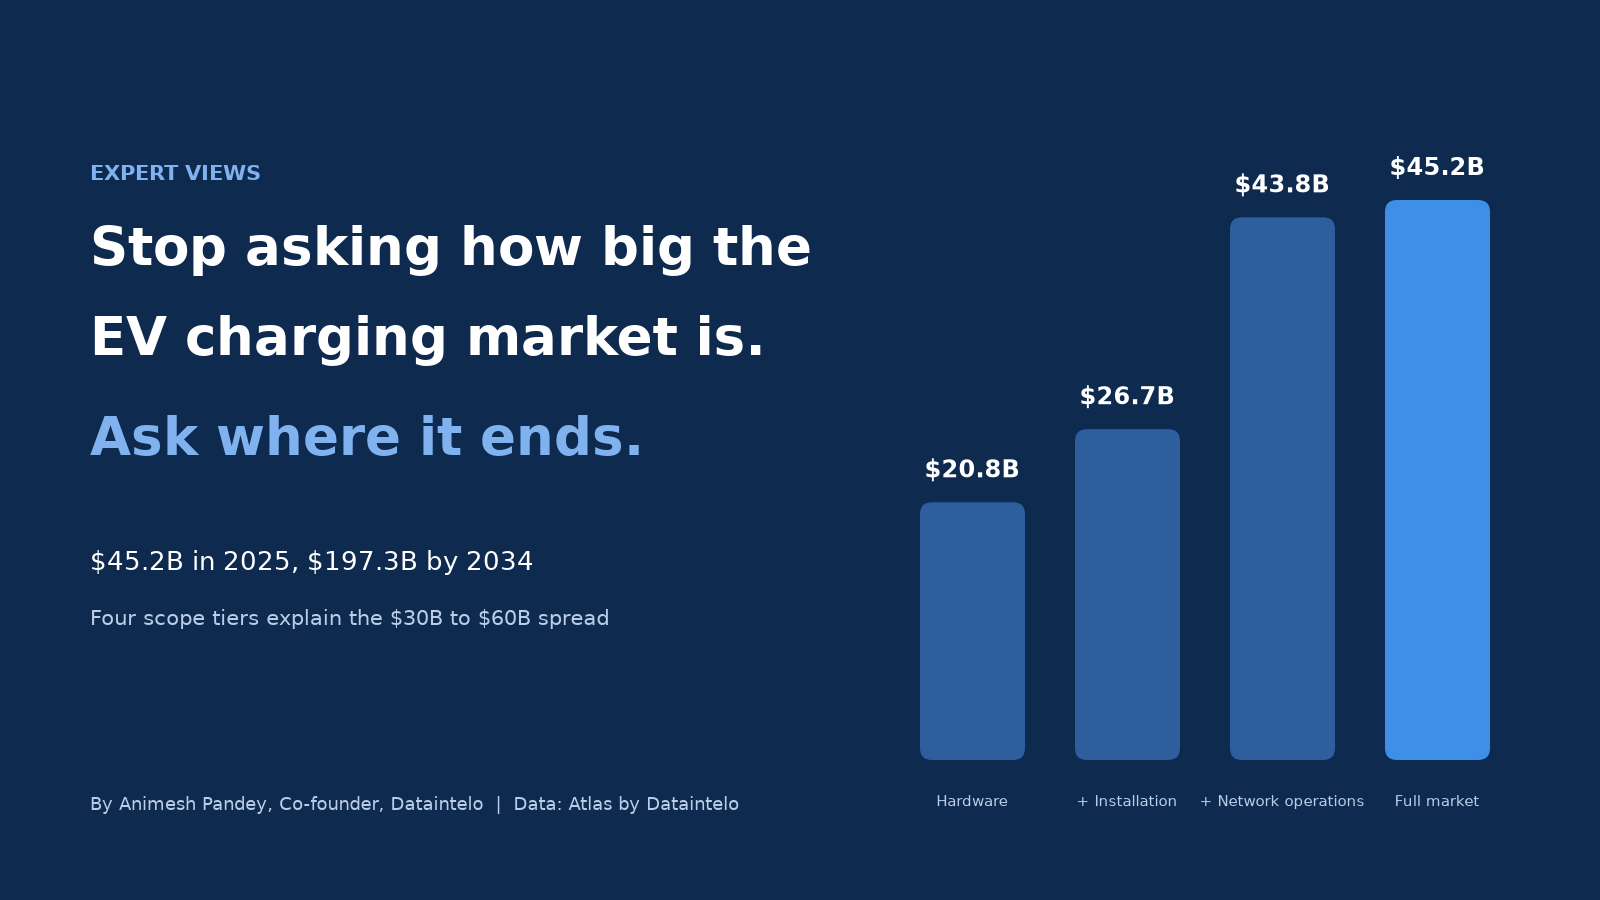
Published sizes for EV charging run from $30 billion to $60 billion. The numbers are not wrong. They answer different questions. Here is how the market breaks down when the boundary is drawn in the open, and what the split says about where the money is moving.
By Animesh Pandey, Co-founder, Dataintelo
Anyone who has tried to build a business case in EV charging has hit the same wall. One report says the market is worth $30 billion. Another says $60 billion. A third lands in between, and none of them show enough of their working for you to reconcile them. Boards notice. Investors notice. And the person defending the plan ends up arguing about somebody else’s arithmetic.
Having sized this market sub-market by sub-market, I can say the disagreement is rarely about how many chargers will be built. It is about where the market ends. Fix the boundary and the spread collapses.
Four defensible answers to one question
We track EV charging infrastructure as five sub-markets under one parent: charging hardware and EVSE manufacturing, home and workplace installation, public charging networks and operations, charging management software and roaming platforms, and battery swapping. Stack them one at a time and you can reproduce almost every headline number in circulation.
Hardware alone, from residential wallboxes to 350 kW liquid cooled cabinets, is a $20.8 billion business in 2025. Add the electricians, groundworks contractors and installers who put those units behind the meter and in the ground, and you reach $26.7 billion. Add the charge point operators who own the assets and bill the driver, and you jump to $43.8 billion, the single largest step on the ladder. Battery swapping, software and a small tail of adjacent lines take the total to $45.2 billion.
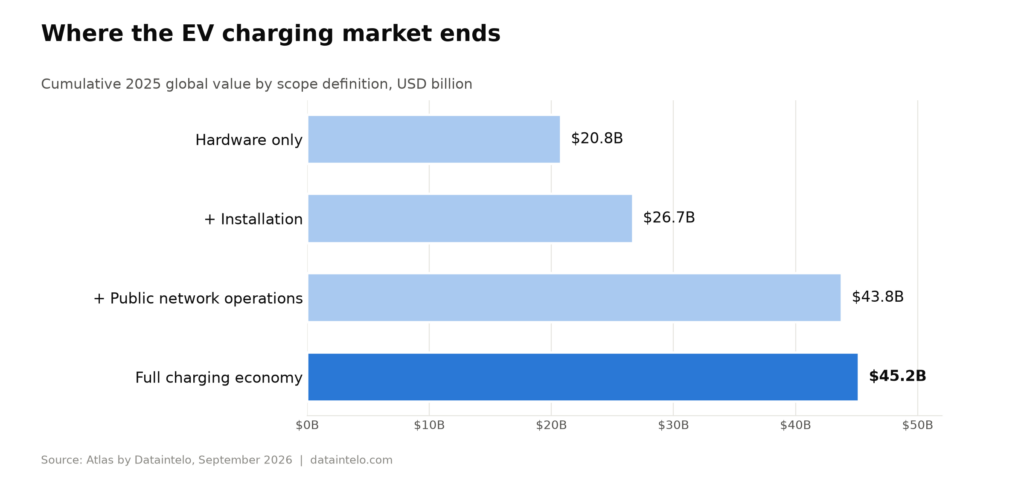
Every rung on that ladder is a legitimate market. A report that lands near $30 billion has usually counted hardware plus part of installation. A report at $60 billion or more has usually stretched the other way, folding in onboard vehicle charging equipment, grid connection and substation work, or the full retail value of the electricity sold through the plug. We track those lines too, and we keep them out, because mixing an energy pass-through into an equipment and services market inflates the growth rate and hides the part a supplier can actually sell into.
So the number we publish is $45.2 billion for 2025, growing to $197.3 billion by 2034. That is a 4.4 times expansion, compounding at 17.8 percent a year. If your plan is built on a different figure, the first thing to check is which tier it belongs to.
The crossover that happens this decade
The more useful finding sits inside the split, and headline reports rarely publish it.
In 2025 hardware manufacturing is still the largest piece, at 46 percent of value. By 2034 it is 33 percent, and public charging networks and operations have taken the top spot at 49 percent, growing from $17.2 billion to $97.6 billion. That is a 5.7 times run against hardware’s 3.1 times. The switch comes well before the end of the forecast: by 2030 network operations reach $44.7 billion against $37.7 billion for hardware.
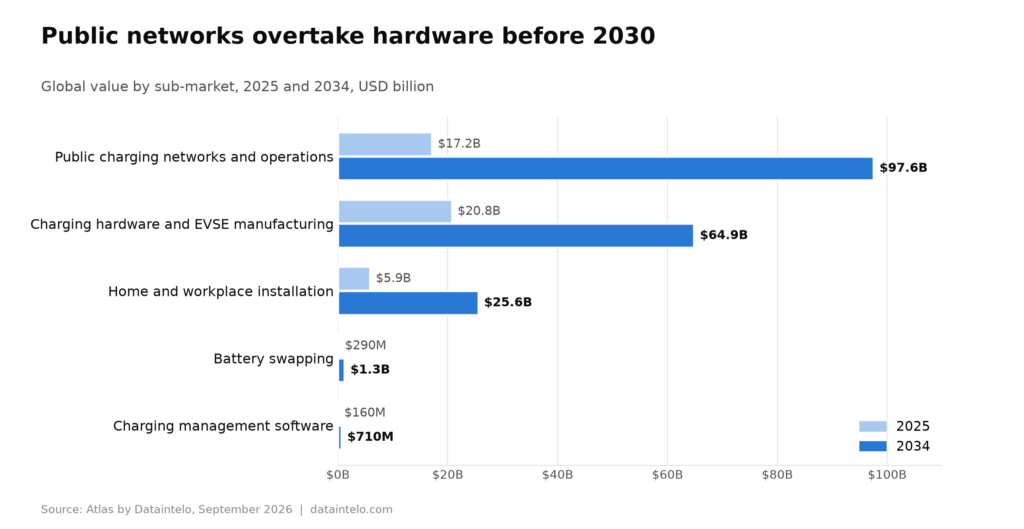
Installation holds a steady 13 percent share throughout, moving from $5.9 billion to $25.6 billion, because every charger still needs someone to fit it.
Two sub-markets need their reputations trimmed. Battery swapping is $290 million in 2025 and $1.27 billion in 2034, about 0.6 percent of the market at both ends. Charging management software and roaming platforms are $161 million today and $705 million in 2034. Both mediate far more value than they capture. Any forecast that presents either as a pillar of the charging economy is describing influence, not revenue.
Selling boxes is not the growth business. Selling sessions is.
The direction of travel was already visible in 2019, when the whole market was $16.5 billion and hardware was 55 percent of it. Hardware has grown well since, from $9.0 billion to $20.8 billion, but its share has fallen every year for a structural reason: the installed base is now large enough to generate meaningful throughput revenue. The money is moving from the one-time sale of equipment to the repeat economics of utilization.
The same logic sorts the winners inside hardware. Ultra fast chargers above 150 kW go from $4.9 billion to $25.3 billion, a 5.2 times run that tracks the network operators rather than the equipment average, and the 250 to 350 kW class grows 5.5 times. Residential AC wallboxes, by contrast, go from $4.5 billion to $10.6 billion, and mid power DC units in the 50 to 150 kW band from $4.5 billion to $9.7 billion. The fast end of the catalogue is growing at more than twice the pace of the rest of it, because operators buy fleets of units and consumers buy one.
The fastest growth is about location, not technology
Rank every charging sub-market above $1 billion by its growth multiple to 2034 and a pattern falls out immediately. Seven of the eight fastest are defined by where the charger sits, not by what it is. The one exception is the high power 250 to 350 kW class above.
Fuel forecourt charging leads everything, growing 8.8 times from $2.2 billion to $19.7 billion, as filling stations convert bays rather than surrender the fuel stop. Urban and metro charging hubs follow at 6.7 times. Apartment and multi-dwelling installations grow 5.8 times, from $1.1 billion to $6.3 billion, faster than single family homes at 4.2 times, which is the clearest demand signal in the dataset for anyone selling into buildings rather than driveways. Grocery and supermarket sites at 5.7 times, highway corridor hubs at 5.2 times and kerbside charging at 5.0 times tell the same story from the other side of the pavement.
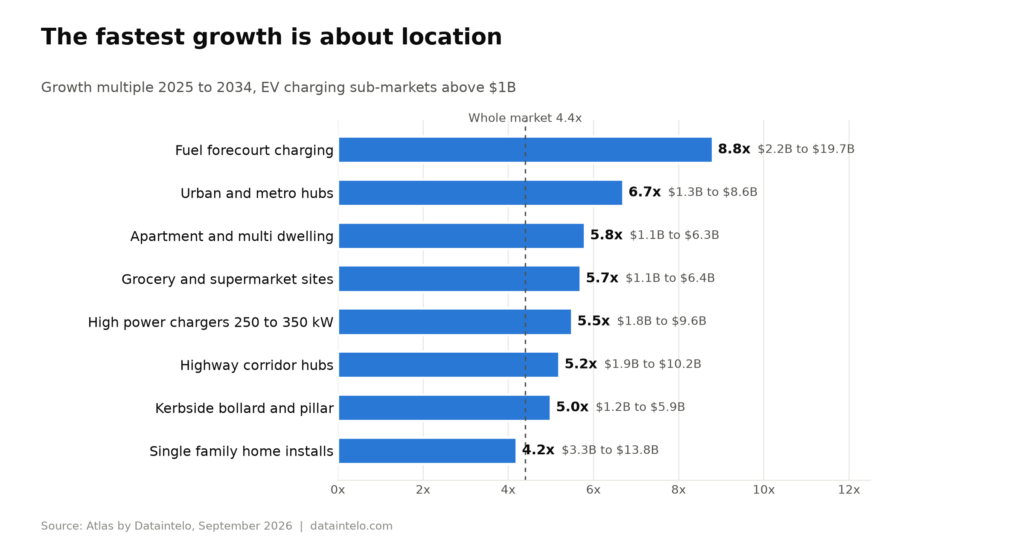
Aggregate those and dedicated charging hubs go from $7.2 billion to $39.3 billion, while retail and destination site charging goes from $3.8 billion to $20.7 billion. Both outgrow the market. Both are property plays as much as energy plays, and the operators who lock up the best sites now will be hard to displace later.
Where the money is today
Geography is more concentrated than most global strategies admit. Asia Pacific holds 51 percent of 2025 charging value at $23.2 billion, and China alone is $15.2 billion, about a third of the world market on its own. Europe is $12.3 billion, or 27 percent, with Germany the largest national market on the continent at $3.1 billion. North America is $7.9 billion, of which the United States is $6.4 billion.
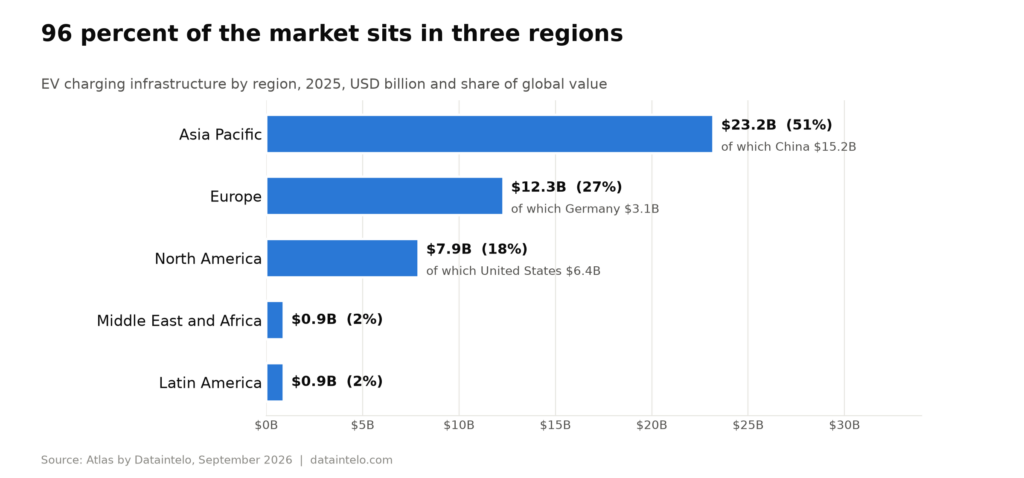
Two figures are worth pausing on. India is $844 million, smaller than Japan at $1.27 billion despite a far larger vehicle parc, because the build-out there is still weighted toward two and three wheeler charging and swapping rather than high power infrastructure. And Latin America and the Middle East and Africa are about $0.9 billion each, 2 percent apiece, which means 96 percent of this market sits in three regions. Any global charging strategy written in 2026 is really a China, Europe and United States strategy with options attached.
What to do with this
If you make chargers, the growth is at the top of the power curve and in the hands of operators who buy in volume. If you operate networks, the $97.6 billion line in 2034 is the prize, and forecourts, hubs and retail sites are where it accumulates. If you install, apartment buildings are growing faster than driveways and are far less well served. And if you are writing a business case against a $30 billion or $60 billion headline, find out which boundary it was drawn on before you build anything on top of it.
The market did not change size. The boundary did. Publish the boundary, and most of the disagreement goes away.
Method note. Figures are from Atlas by Dataintelo, a market intelligence platform that sizes every market in its tree individually and reconciles sub-markets to their parents. EV charging infrastructure is built from five sub-markets with anchors at 2019 and 2025 and forecasts to 2030 and 2034, in US dollars at current prices, drawn from public and official sources, company filings, government statistical series and industry associations. The dataset reflects September 2026. The full breakdown, with charts, is published at dataintelo.com/insights/ev-charging-market-size-2026.
About the author. Animesh Pandey is co-founder of Dataintelo, a market research firm, and leads Atlas by Dataintelo, an industry intelligence platform covering more than 100,000 markets with country splits, company boards and forecasts to 2034.